Big Earthquakes Strike Chile and Peru

The USGS map of the earthquakes off South America.

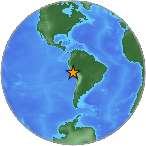
Several large earthquakes occurred September 25, 2013 along the western coast of South America – USGS.

Wednesday morning, September 25, 2013, a 5.2 magnitude quake shook Atacama, Chile, and this started a reaction of large earthquakes along the Eastern Pacific Rim’s Ring of Fire.

Within hours of one another, the following earthquakes occurred:

  1. 5.2 – Atacama, Chile
  2. 5.8 (downgraded to 5.4) – Attu Station, Alaska
  3. 7.0 (downgraded from 7.2) – Acari, Peru

Tsunamis and Volcanoes

Earthquakes of this magnitude can create tsunamis, but tsunami warnings have not been issued for the Hawaiian islands.

Several active volcanoes are in this region, also, so monitor an increase in volcanic activity over the next few days.

The volcanoes in Chile that have erupted since 2010 to the present:

  1. Chaiten
  2. Copahue
  3. Planchon-Peteroa
  4. Cordon Caulle

The volcanoes in Peru that have erupted since 2010 to the present:

  1. Sababcaya
  2. Ubinas


Bigger Quakes Shake Southern Hemisphere

Disney Wildlife Preserve Florida, USA on the LISS Seismic Server showing an increase in seismic activity on 4-6-13

A seismograph reading showing an increase in earthquake activity.

The Southern Hemisphere was very active with large earthquakes and volcanic rumbles on July 7, 2013.

By mapping the locations of these quakes, you can see increased wobbling at the Earth’s poles; you can see the climb in earthquake intensity, and you can also see how the magnitudes of these quakes have been lowered a bit.

Two Tips For Watching Quakes

Here are two, basic tips to watch for when you read about global earthquakes:

  1. watch the magnitudes go up or down
  2. look for a pattern in quake locations

I really don’t think the magnitudes that are logged in the record books are completely accurate despite the millions of dollars USGS invests in equipment. If you look closely on their website, you’ll see how many quakes are recorded at 2.9, 3.9, 4.9, 5.9, 6.9, 7.9 and so on …..

Filling Up At The Pump

A picture of gas prices.

Earthquake magnitudes are like gas prices – they record them just a little under their real readings to make you think they are a little lower than what they really are.

It slays me to see gas prices go up and down for no logical reason, but what really gets me is how the prices are posted in ways to make you think the prices are a little lower than they are.

Advertisers do this for just about anything you buy – $9.99 or $49.99 – why not just call a duck a duck and label the things accurately … it’s not $9.99, it’s $10 bucks + tax.

Well, it seems USGS does this, too, by lowering the magnitudes of earthquakes to just below a measurement that shows the increase in earthquakes today.

EQs July 7, 2013

Out of 134 quakes that occurred on July 7, 2013, 57 quakes were above 4.5, but 19 were logged as a .9, and 10 were recorded as a .8. This may be no big deal, but when it comes to accuracy, I want my data true data, especially when it focuses on the LARGER earthquakes. So, for the list below,  I’d at least bump the .9 quakes up 1/10 of a point.

Here’s the July 7, 2013 list of large quakes in the Southern Hemisphere in order of occurrance, and look at these point patterns:

  1. 7.3 Solomon Islands (lowered to 7.2)
  2. 6.6 Kandrian, New Guinea
  3. 4.8 New Zealand
  4. 5.8 Pujiharjo, Indonesia
  5. 5.9 El Rosario, El Salvador
  6. 4.7 Visokoi Island off Argentina
  7. 4.9 Barbuda

Does It Really Matter?

Do the magnitudes really matter if they are off by a 1/10 of a point or so? Yes and no. The system is merely a human interpretation, anyway. Magnitude scales may be way off and we just haven’t considered changing it.  But, if an earthquakes is really a 5.0 magnitude,  I’d like to know that as opposed to seeing it recorded as at 4.9.

In the long-run, THIS does make a difference, especially with larger quakes.


MayDay – May 2013 Begins With An Increase In Earthquakes

Here is a list of the earthquakes that occurred over the past 24 hours at a 4.5 magnitude and above: (Note –  Vanuatu is VERY active right now, which starts a chain reaction of quakes worldwide.)

April 30, 2013

A USGS small globe map showing the April 30, 2013 earthquake in the Celebes Sea.

April 30, 2013 earthquake in the Celebes Sea – USGS

4.6 Celebes Sea

5.3 SW Siberia, Russia

4.9 Atacama, Chile

5.9 Azores Islands, Portugal

5.3 Leeward Islands

A USGS small globe showing the April 30, 2013 earthquake in Eastern Kashmir, Russia.

April 30, 2013 earthquake in Eastern Kashmir – USGS

4.6 Eastern Kashmir

5.3 Sulawesi, Indonesia

5.0 Region Metropolitana, Chile

4.8 Tonga

5.3 Balleny Islands Region, Antarctica

A USGS map of the Earth at the South Pole near Antarctica.

April 30, 2013 earthquake off Antarctica – USGS

4.7 Iran-Pakistan Border

4.5 Eastern China

4.9 Vanuatu

4.5 Potosi, Bolivia

May 1, 2013

A USGS small globe showing the May 1, 2013 earthquake swarm around Vanuatu.

May 1, 2013 earthquake swarm around Vanuatu – USGS

4.6 Vanuatu

5.3 Luzon, Philippines

5.8 Eastern Kashmir (India Meteorological Dept) – 5.4 (USGS)

4.9 Mendoza, Argentina

4.6 Eastern Kashmir

A USGS small globe showing May 1, 2013 7.8 EQ in Iran

May 1, 2013 earthquakes in Southern Iran – USGS

5.1 Vanuatu

4.5 Southern Iran

5,1 Southern Iran

5.7 Offshore Honshu, Japan

4.5 Southern Iran